FreeholdCurrently tenantedGST applies to the price
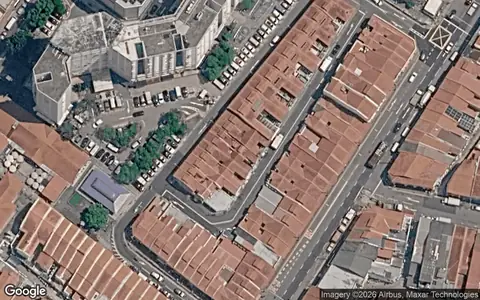
District 8 · Jalan Besar · Strata commercialSim Lim Tower
A whole-floor freehold strata unit, currently tenanted. Unit and floor withheld.
S$9,261,999 + GSTS$2,200 psf · 4,210 sqftⓥ
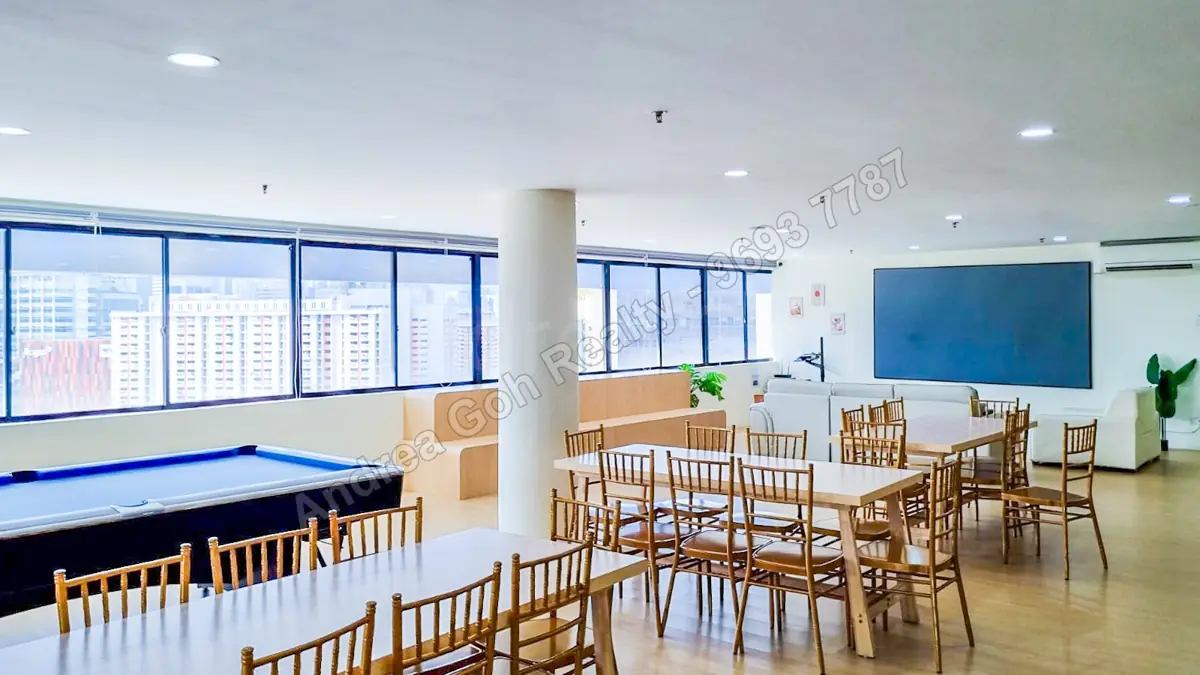
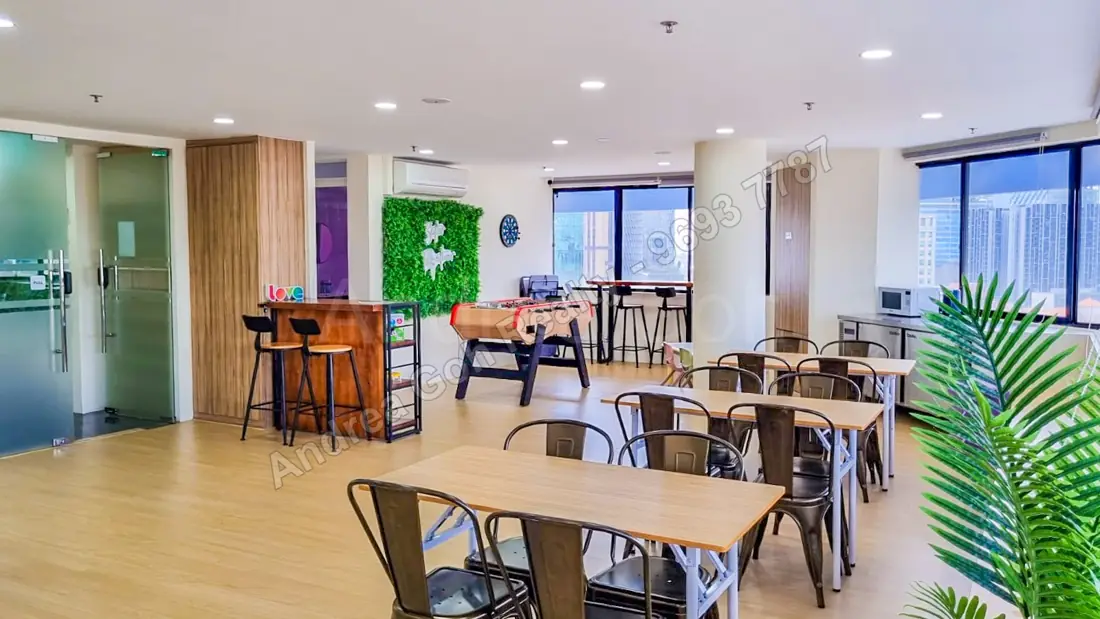
A whole-floor freehold strata unit, currently tenanted. Unit and floor withheld.
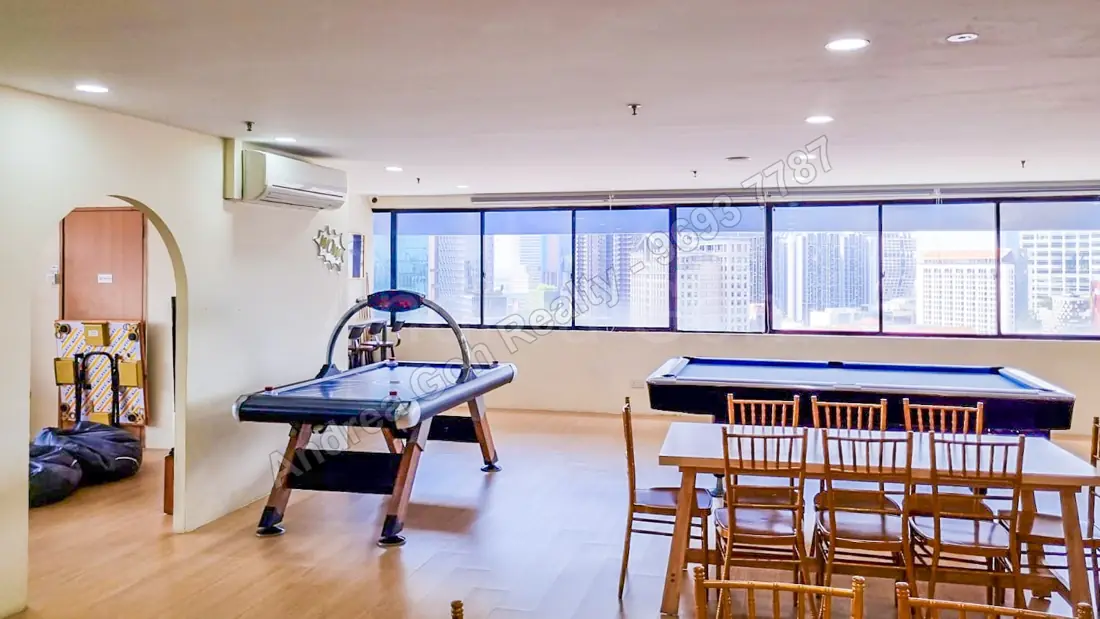
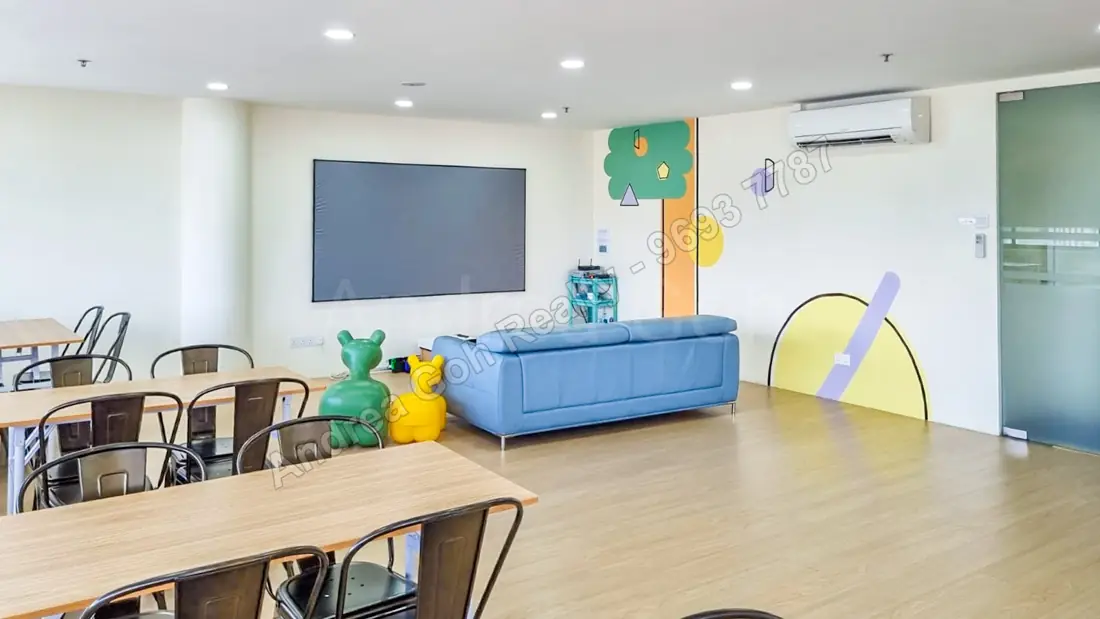
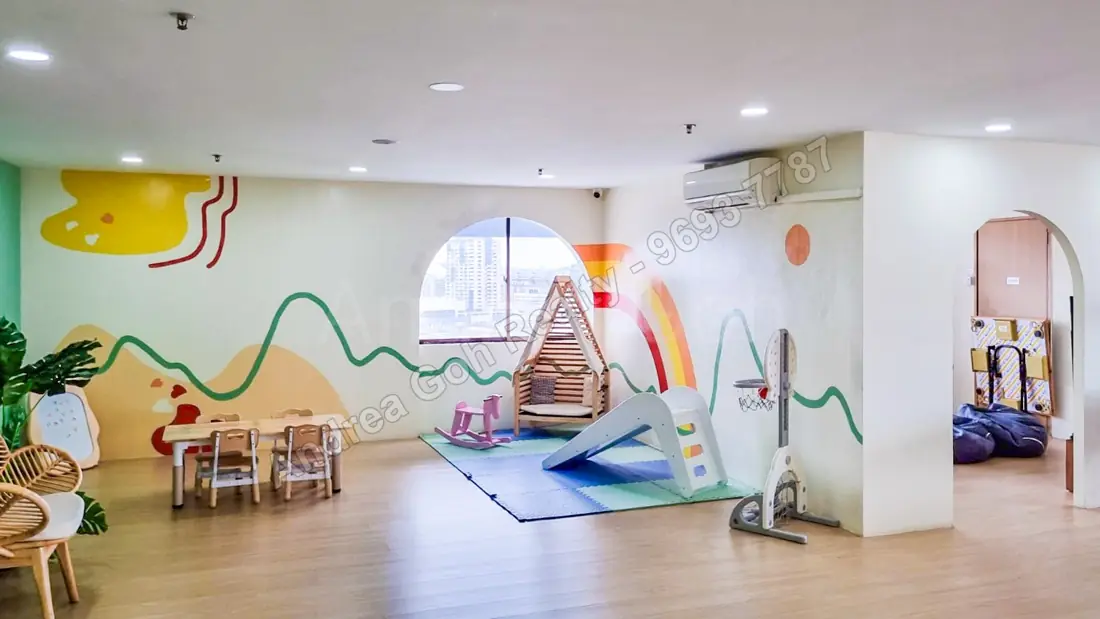
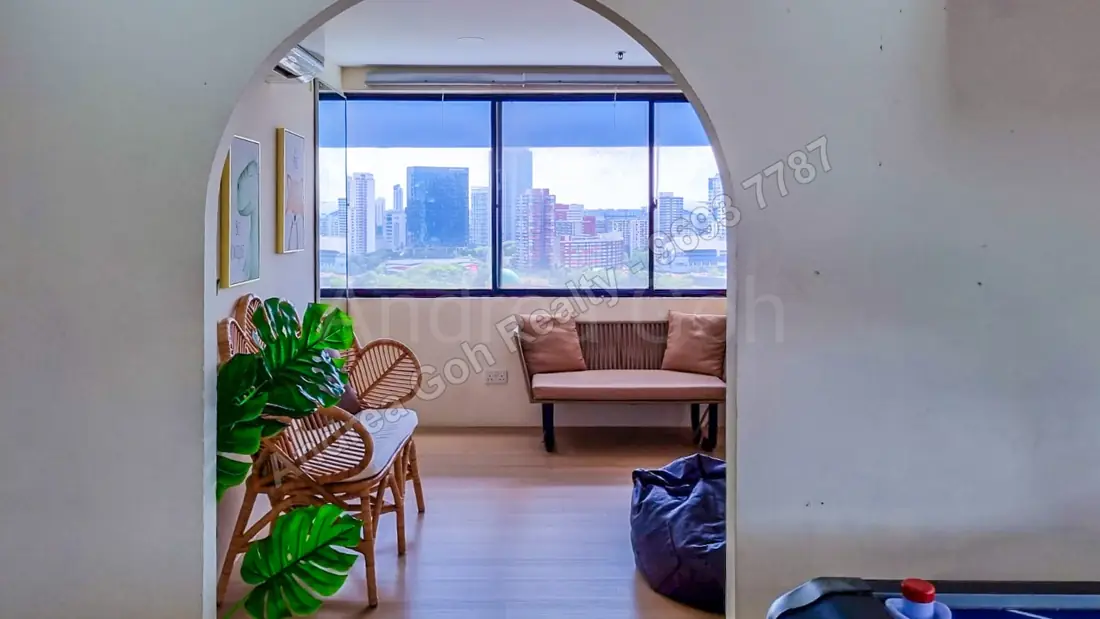
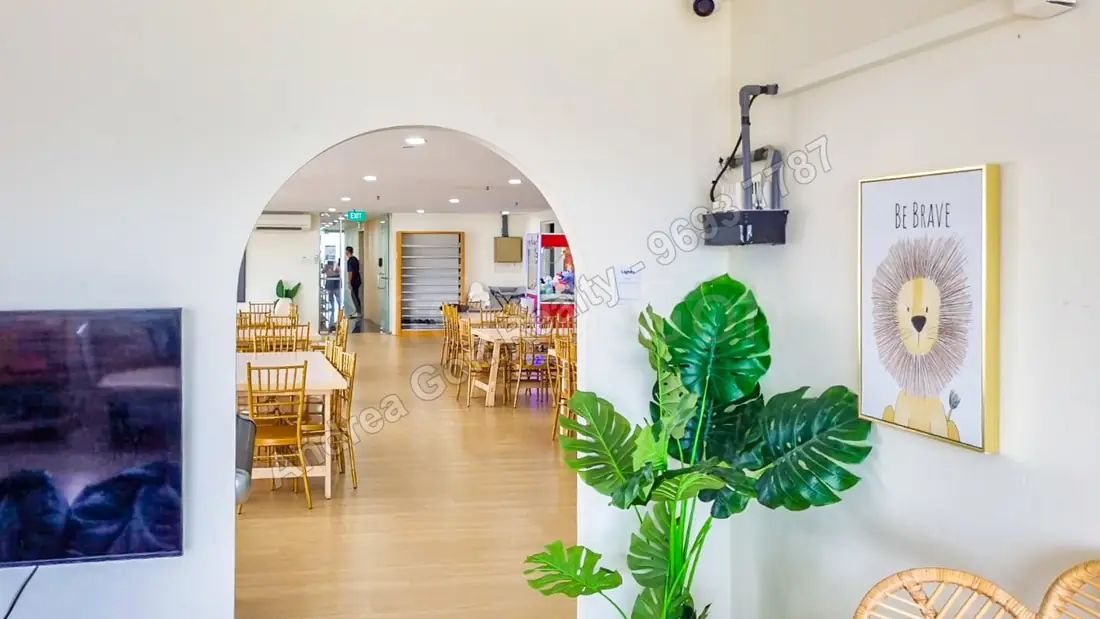
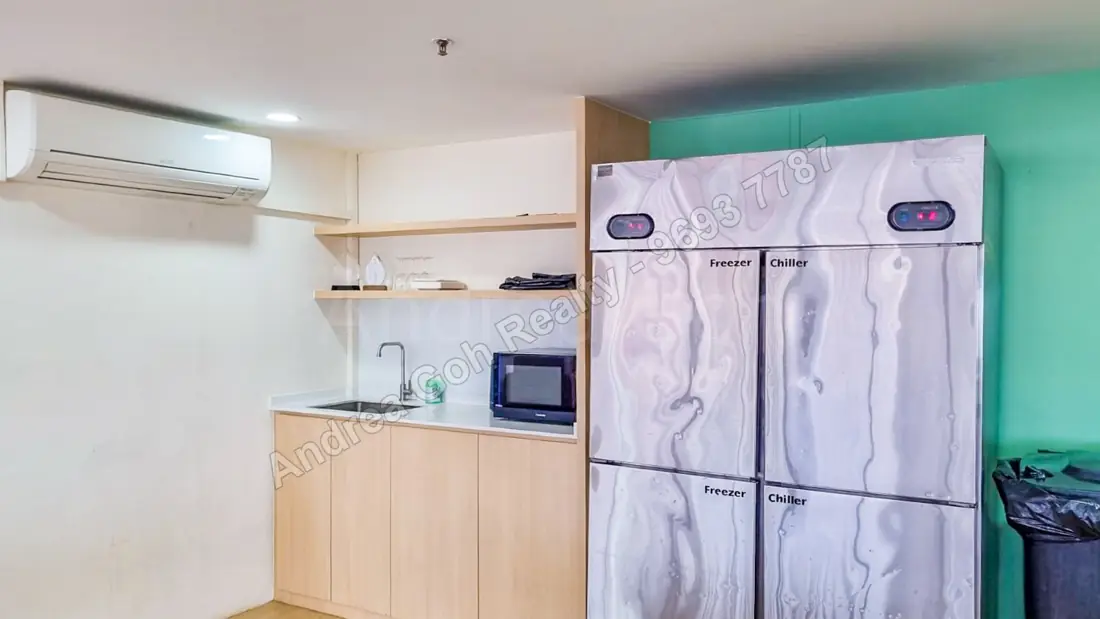
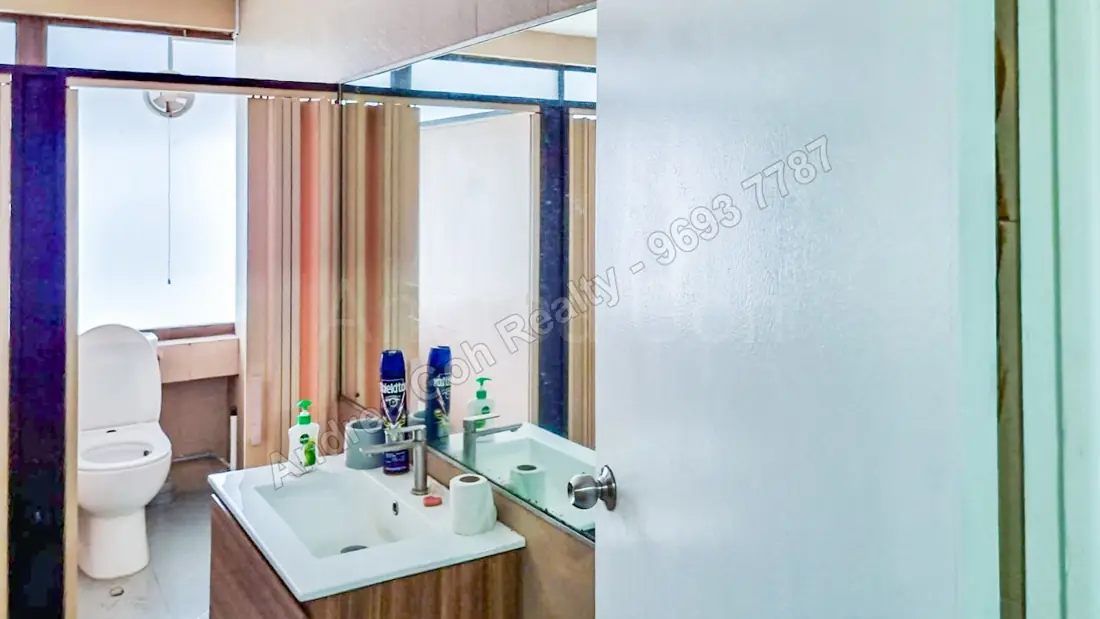
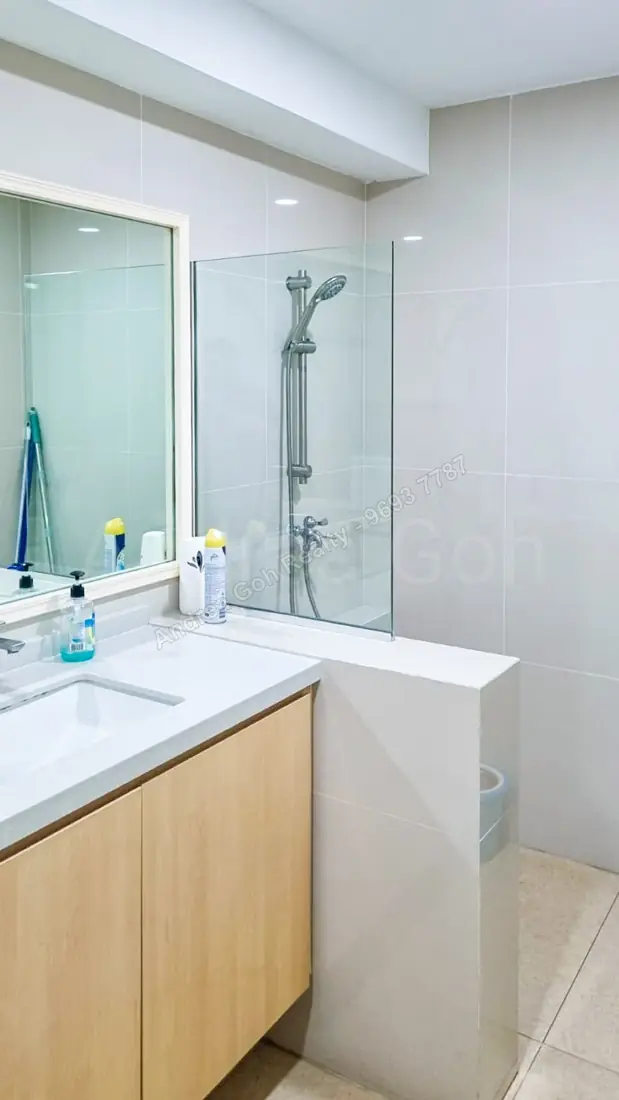
Photos show the unit as currently tenanted. The fit-out and furniture belong to the tenant and may not remain.
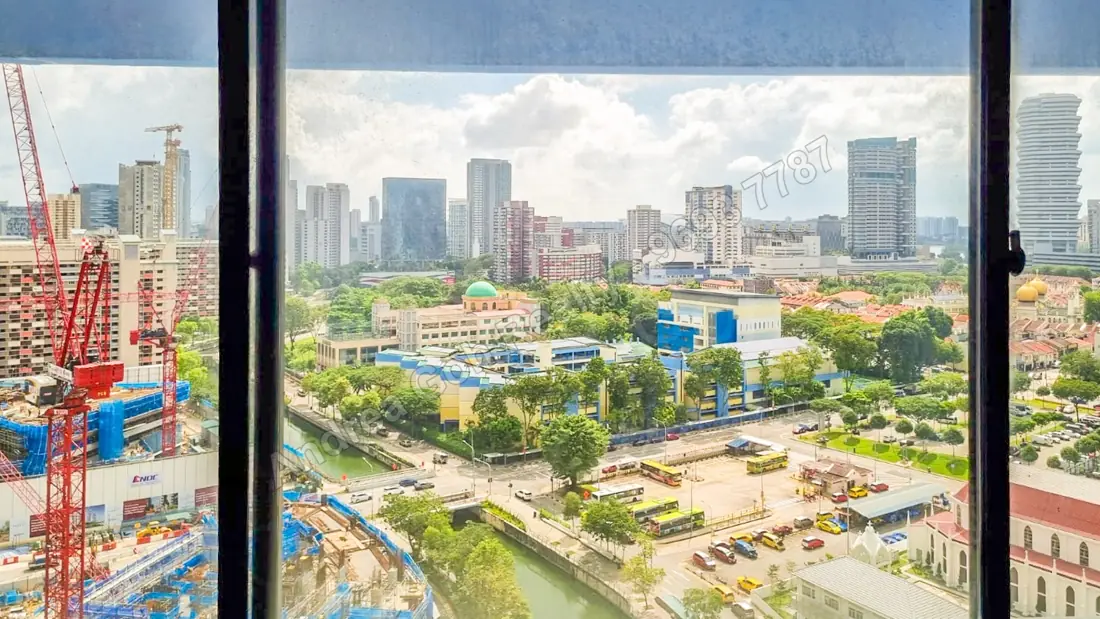
Tap a category to see just those pins on the map.
OneMap-routed distances/times; ratings via Google Places, indicative and subject to change.
Times are indicative — weekday 08:30 for public transport (OneMap routing); drive times are off-peak, no live traffic — both vary with actual conditions.
| Recent sales · same building (strata) | Sold | Tenure | Price | psf |
|---|---|---|---|---|
| Sim Lim Tower (same building) 3,283 sf · shop | Sep 2022 | Freehold | S$6.699M | S$2,040 |
| Sim Lim Tower (same building) 3,283 sf · shop | Jul 2018 | Freehold | S$5.2M | S$1,584 |
| Sim Lim Tower (same building) 840 sf · office | Apr 2026 | Freehold | S$1.63M | S$1,941 |
| Sim Lim Tower (same building) 592 sf · office | May 2025 | Freehold | S$1.27M | S$2,145 |
| Sim Lim Tower (same building) 592 sf · office | Mar 2025 | Freehold | S$1.26M | S$2,128 |
URA transactions in Sim Lim Tower as shown on EdgeProp (checked 20 Oct 2026; verify on URA REALIS). Largest units first, then the latest office sales. There is no sale of a floor this size in the last four years, and small units trade at a different psf from a whole floor, so treat these as a REFERENCE, not a valuation.
Commercial sales attract GST when the seller is GST-registered. Confirm the seller's status and whether you can claim it back.
Indicative only — confirm stamp duty, GST & apportionment with your lawyer / IRAS.
| Claim | Figure | Where it holds | Source |
|---|---|---|---|
| Private-sector office space vacancy was 11.2% in 2Q 2026, up 0.4 points from 10.8% the quarter before (SingStat). | 11.2% | island | SingStat, available and vacant commercial/industrial space (private sector) [1] · as at 2026-11-01 |
Figures are quoted or counted from the sources shown, at the narrowest scope they support -- never an unqualified 'only'.
Published government plans near this property — the facts, with sources. What they mean for value is a question worth asking.
Who actually lives here — this subzone, Census 2020.
How to read this. The line in the middle is the Singapore average, set to 100. A bar to the right means more of that age group live in this area than the national share (idx 113 means 13% more); a bar to the left means fewer (idx 78 means 22% fewer). The percentage is that group's share of local residents. Residents are not the same as the people who would visit or work here, and the figures are from Census 2020.
~0% of Rochor households span 3 or more generations (indicative — OneMap Census 2020).
Does this age mix match the trade you're considering?
General market information on this page was last updated on 1 Nov 2026.
The real number, what it means here, and the question it leaves you with.
Indicative answers — confirm with your lawyer, URA and IRAS.
Not quite the one? A few more from the current collection in a similar bracket — happy to walk you through any of them.
For buyers who haven't transacted before: the resale journey, stage by stage.
Indicative for a non-residential resale purchase — GST timing and any ABSD depend on the specific unit; see the numbers section above. Confirm with your lawyer.
Investor Numbers Pack. A named report with your numbers — no pitch, no obligation.
Send me the Investor Numbers Pack中文版计算器 · Calculators in English
Per-level use, transacted comparables, stamp-duty and yield — the way this page was built. No obligation.
Ask Andrea Goh for my property report