Continue exploring
Also available
Not quite the one? A few more from the current collection in a similar bracket — happy to walk you through any of them.
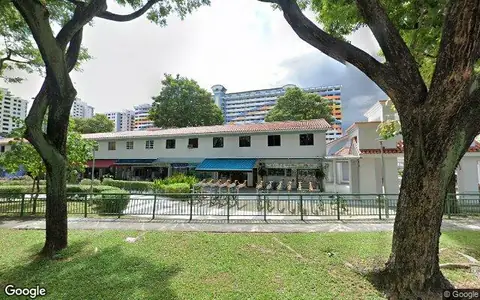
An HDB shophouse on Sims Avenue, currently a clinic, sold as a whole unit.
Tap a category to see just those pins on the map.
OneMap-routed distances/times; ratings via Google Places, indicative and subject to change.
🚌 Bus stops nearby:
Times are indicative — weekday 08:30 for public transport (OneMap routing); drive times are off-peak, no live traffic — both vary with actual conditions.
| Recent HDB-shophouse sales · Sims area | Sold | Tenure | Price | psf |
|---|---|---|---|---|
| Sims Place 1,345 sf | Mar 2026 | HDB LH | S$2.45M | S$1,821 |
| Sims Avenue 1,496 sf | Jul 2025 | HDB LH | S$1.73M | S$1,156 |
| Sims Avenue 1,604 sf | Mar 2020 | HDB LH | S$1.765M | S$1,100 |
URA REALIS caveats for HDB shophouse sales on Sims Avenue, Sims Place and nearby (file last refreshed 16 Jul 2026; verify on URA REALIS). A REFERENCE, not a like-for-like valuation: shophouses vary by exact location, frontage, footfall, size and remaining lease, even on the same road.
| Claim | Figure | Where it holds | Source |
|---|---|---|---|
| Private-sector retail space vacancy was 7.0% in 2Q 2026, up 0.6 points from 6.4% the quarter before (SingStat). | 7.0% | island | SingStat, available and vacant commercial/industrial space (private sector) [1] · as at 2026-11-01 |
| For resale retail space, average psf for freehold went from $1,659 to $3,737 (+125.26%) between 1995 and 2026, against $1,173 to $2,751 (+134.53%) for leasehold. 2026 is a part-year. The averages mix ages, locations and sizes. | 125.26% | island | PropNex Investment Suite ProTrend, generated 30 Sep 2026 · as at 2026-09-30 (indicative) |
Figures are quoted or counted from the sources shown, at the narrowest scope they support -- never an unqualified 'only'.
Published government plans near this property — the facts, with sources. What they mean for value is a question worth asking.
URA retail price index sat at 105.5 in Q3 2026 (+1.1% QoQ, +5.8% YoY) (URA via data.gov.sg).
URA retail rental index printed 81.2 in Q3 2026 (+1.4% YoY) (URA via data.gov.sg).
SingStat's Retail Sales Index printed 102.6 in Aug 2026 (+0.7% YoY).
Geylang has an estimated ~49,000 resident households (~10,900 condo, ~1,500 landed) (SingStat GHS 2025).
Singapore households spend on outpatient care services: HDB 4-rm ~$278, condo ~$353, landed ~$599/month (SingStat HES 2023).
Who actually lives here — this subzone, Census 2020.
How to read this. The line in the middle is the Singapore average, set to 100. A bar to the right means more of that age group live in this area than the national share (idx 113 means 13% more); a bar to the left means fewer (idx 78 means 22% fewer). The percentage is that group's share of local residents. Residents are not the same as the people who would visit or work here, and the figures are from Census 2020.
17.9% of employed residents in Geylang earn S$10,000+/month (idx 99, below SG avg).
~7.7% of Geylang households span 3 or more generations (indicative — OneMap Census 2020).
Does this age mix match the trade you're considering?
General market information on this page was last updated on 1 Nov 2026.
The real number, what it means here, and the question it leaves you with.
Indicative answers — confirm with your lawyer, URA, HDB and IRAS.
Not quite the one? A few more from the current collection in a similar bracket — happy to walk you through any of them.
For buyers who haven't transacted before: the resale journey, stage by stage.
Indicative for a non-residential resale purchase — GST timing and any ABSD depend on the specific unit; see the numbers section above. Confirm with your lawyer.
Investor Numbers Pack. A named report with your numbers — no pitch, no obligation.
Send me the Investor Numbers Pack中文版计算器 · Calculators in English
Per-level use, transacted comparables, stamp-duty and yield — the way this page was built. No obligation.
Ask Andrea Goh for my property report